What-Changed Analysis
It is often difficult to determine what is driving changes to risk statistics over time just by looking at a portfolio, which is why we created the What-Changed Analysis tool.
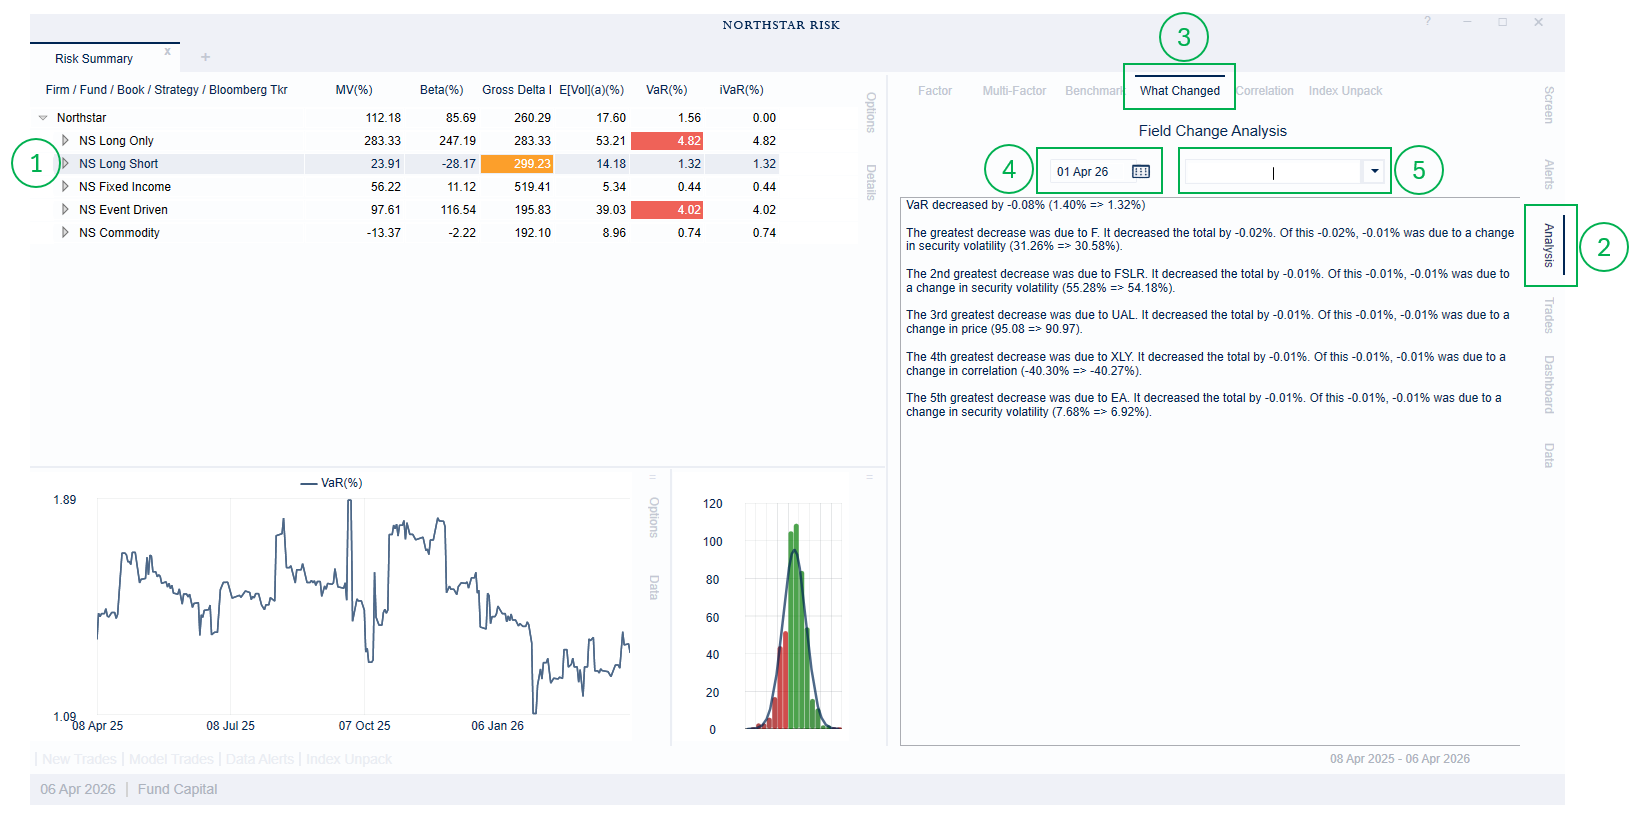
To use the What-Changed Analysis tool,
In the main grid, select the portfolio that you wish to analyze.
Open the Analysis tab.
Select the What Changed sub-tab.
Choose the date to which you want to compare the current portfolio.
Select the statistics that you would like to analyze
The first time you perform a what-changed analysis for a given date, the application will load the previous date from your data warehouse. This will take approximately the same amount of time as opening the application.
The analysis will explain the changes in terms of the sub-portfolios in the main grid. If you select a fund that is grouped by region, the change in risk of the fund will be explained in terms of changes to the risk characteristics of the region sub-portfolios.
For statistics that are not additive, such as VaR and expected volatility, these calculations can be slow for portfolios with a large number of sub-portfolios. The application will provide a warning before any calculation that is expected to take more than 15 seconds. To reduce the calculation time, you can first group the portfolio in the main grid.
Side-by-Side Portfolio Comparison
You can also view two dates, side-by-side, in the main grid by going to the Options menu, then the View sub-menu and choosing a date next to Compare To. For more on this and changing the main grid, you can read more here.