
Correlation Analysis
The correlation analysis tab, found on the Analysis tab on the right side of the application, can be opened from any screen.
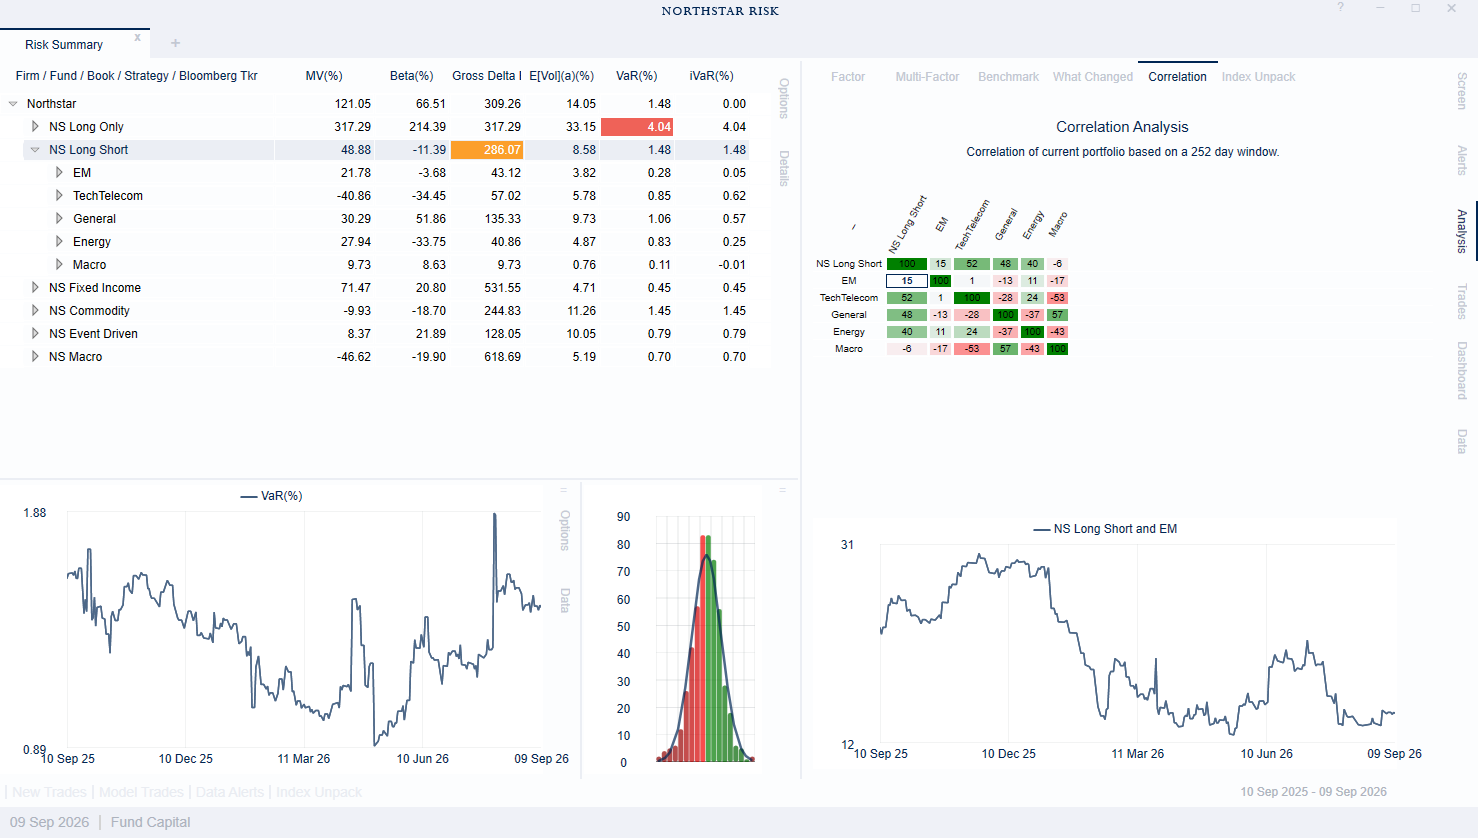
The data represents the risk for the selected portfolio in the main grid, to the left. The rows and columns of the correlation matrix reflect the grouping of the main grid.
The correlations are based on backcast series, using a 252 window, and no decay.
If you click on any cell in the correlation matrix, you will get a chart showing the rolling 252-day correlation over the past 252 days. This can be use to gauge the stability of the correlation matrix.